8. When the economic or market cycle is in expansion, people tend to favor Growth investments.
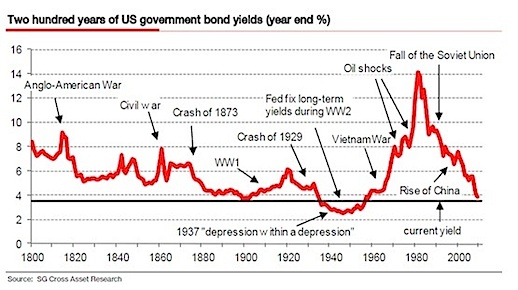
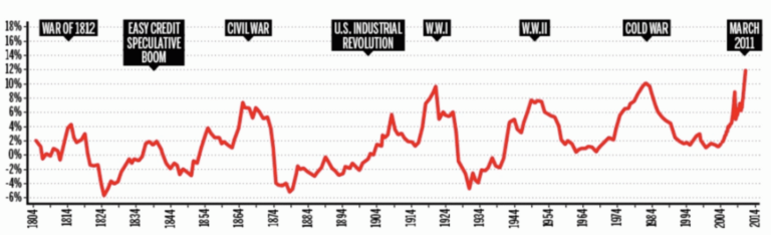
When the cycle shifts to contraction, people tend to favor Value investments. Observe the two charts below. First, we see two-hundred year history of commodity prices (Growth) followed by a two-hundred year history of bond interest rates (Value).
The below charts show commodities (growth) and bonds (value) investments over two hundred years. If you only look at the very beginning and the very end of the two-hundred years, prices will appear to have changed very little. However the difference in prices is extreme when you look at every ten to thirty years in between the two hundred years. Most importantly, the above charts show how different periods of distress and optimism affected growth and value investments in different ways.
9. There are always smaller cycles within bigger cycles.
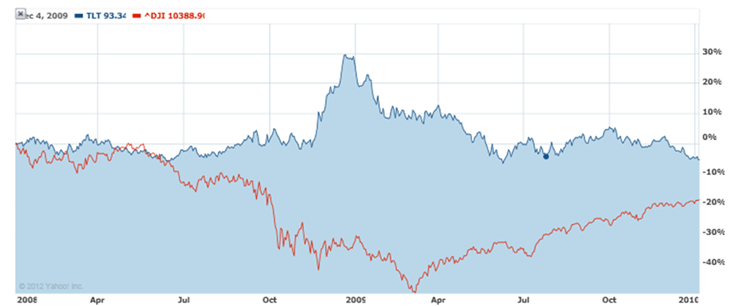
Within long-term market and economic cycles that last for ten to thirty years, we can also observe that there are shorter-term cycles that can occur every one to four years (please refer to the two charts below). When we zoom in over the last ten to thirty years and look at what happens in just less than ten years, we can observe that both growth and value investments continuously expand and crash with cyclical regularity. This fact can be easily observed through the Stock Market Crash of 2008--when stocks (growth) are compared to US government bonds (value). The first chart below shows us what happened between 2008 and 2010, a period of only 2 years. At the peak of the crisis, stocks were down nearly 40%, and bonds were up nearly 30%.
A Two Year Chart of Growth (Dow Jones 30 Stock Index) vs. Value (US Government Bonds) during the Crash of 2008
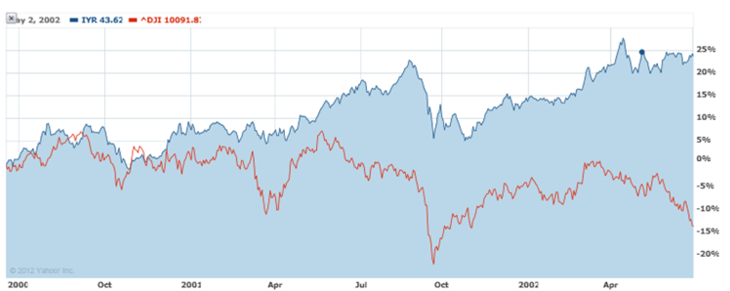
But what about the other times beyond 2008-2010? For another similar event, we look to the “Internet Stock Bubble of 2001.” In this example, we use the Dow Jones Real Estate Index (value) versus the Dow Jones Industrial Average (growth) over two years. Once again, the phenomenon of money transferring from one form to another holds true. The Stock Index lost nearly 15% whereas the Dow Jones Real Estate Index gained nearly 24%, in just two years.
10. Sir Isaac Newton’s Third Law of Motion: For every action there is an equal and opposite reaction.
From the two charts above, we can clearly see that the negative action of growth markets had a positive reaction in value markets. At the peak of each crisis, you can clearly observe that value investments were positive, as growth investments were negative.
In conclusion, long-term and short-term cycles of market price expansions and contractions are inevitable. If short-term speculators can align their short-term trading strategy to the long-term market cycle, they can make significant profits from long-term trends without persistent exposure to the market. If long-term investors assume markets will inevitably have regression periods throughout a long term expansion they can use those periods as opportunities to increase long-term holdings at a substantially lower cost basis instead of adhering to a linear “buy and hold” philosophy.
A Two Year Chart of Value (Dow Jones Real Estate Index) vs. Growth (Dow Jones 30 Stock Index) during the Recession of 2001
The red line below represents the price of all commodities using a 10 year average over the last 207 years.
1. Money is a form of energy.
2. The Principle of Conservation of Energy states that energy can only be transferred from one form to another; but it cannot be created or destroyed.
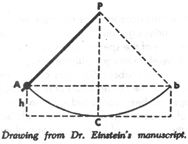
Energy exists between the two main states of "kinetic energy" and "potential energy." Within each state, energy can be subdivided into more specific categories such as, motion, heat, and electrical energy. For an example of this fact, observe Albert Einstein’s image of a pendulum from a 1946 edition of Science Illustrated.
Points C to P: display the range of the pendulum, when it's at rest, in the state of potential energy. Points A to b: represent the pendulum’s range of movement when kinetic energy is exhibited in the form of motion.
3. Since money is a form of energy, it is not created or destroyed. It is transferred.
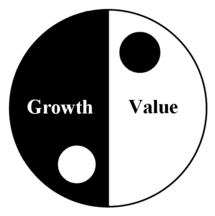
4. As with energy, money has two basic states that it can be transferred into.
Instead of kinetic and potential, these two basic states of money are defined as "growth" and "value." Growth tends to represent an investment with the highest potential for reward. Some examples of growth investments are stocks, junk bonds, raw land (undeveloped real estate), and certain commodities. On the other side, value tends to represent an investment with the least risk. Some examples of value investments are income property (rentable real estate), government bonds, as well as certain commodities.
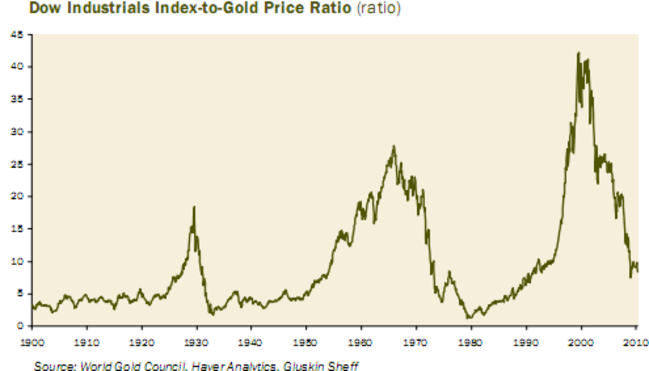
In the graphic below, observe a one hundred year history of growth investments versus value investments through the relative price performance of the Dow Jones Industrial Stock Index versus the price of gold.
You can see that over one hundred years stocks (growth) have extremely outperformed the price of gold (value) at three specific times (around the late 20s, mid-late 60s and late 90s). You can also see that at different three times there was an extreme under-performance of stocks to gold (in the early 30s , early 80s, and in 2009).
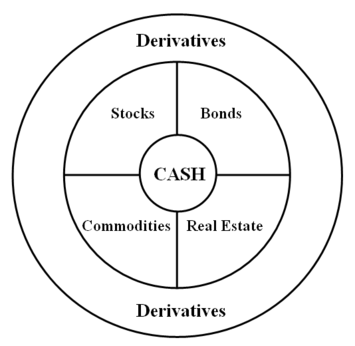
5. Within the two states of "growth" and "value," there are only six specific investment markets money can go into.
They are derivatives, stocks, bonds, commodities, real estate, and cash.
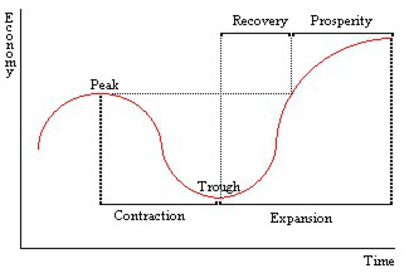
6. The basic aspects of our natural lives are cyclical.
Every year, our planet moves around the sun in a repetitive cycle. This cycle produces different lengths of daylight and heat during different days of the year. This astronomical cycle expands into a meteorological cycle on Earth, where seasonal periods of time will be more moist or dry. These cycles are an example of the basic order of repetition on which all our lives are based. Although, this cycle is not perfectly identical each time, the basic aspects remain unchanged.
7. As life is cyclical, the same is true for economies and markets.
In the last two hundred years, the human race has achieved many milestones of positive expansion, from the invention of the electrical light to space travel. Also in this time span, the human race has experienced periods of negativity--such as wars, diseases, and natural disasters. But overall, humanity has advanced. In 1800, the world population was 970 million people. In 1980, it was 4.435 billion. In 2012, the world population stands over 7 billion. In the long-term, as long as global populations grow, consumption will grow. This consumption includes everything from toothpaste and soap to automobiles and airplanes. When consumption grows, economic expansion is inevitable. In the short-term, contractions will always be an integral part of the long term expansion of humanity. These continuous expansions and contractions constitute a repetitive economic and market cycle.
The Economic and Market Cycle
Figueroa at Wilshire, 601 South Figueroa St, Suite 4050, Los Angeles, CA 90017 | tel: 855.771.0473 | fax: 310.881.1139 | deep@mangatanalytics.com
Mangat Analytics © 2019. All rights reserved